The Goal Hub offers a more in-depth way to manage and explore your goals - it's designed to enhance your experience by providing quick access to key information without disrupting your workflow. Whether you’re managing updates or viewing important updates, the Goal Hub keeps everything within easy reach.
Clicking on any Objective or Measure or Action will show the Sidebar page for that specific goal, select the Goal Hub button located at the top right to access it. 
With the Goal Hub, you can:
-
obtain a holistic view of performance, understand key priorities/challenges, and plan your efforts accordingly
-
visualize how an entity has performed over time, against expectations - progress and health
-
inspect the audit trail for an entity and obtain more details about a specific event
-
visualize in real-time with data rendered from inline changes, table updates, etc.
The Goal Hub offers a detailed view of the goal you've selected. Keep in mind that your existing plan permissions still apply—editing objectives, actions, or measures is only possible if you have the appropriate access rights.
Goal Hub Layout
Depending on what type of entity you are viewing, the layout of the Goal Hub will be a bit different.
Objective view:
Action view:

Measure view:
What does each tab show?
Progress Tracking:
Shows the actual progress made against the expected progress alongside the health it represents at the time of update.
Remember that you'll not be able to edit the actual value or historical progress for integrations-enabled or metrics-connected measures in the Goal Hub.
In the case of measures, a data table will appear showing the date, target, actual running total and actual net change:
-
The target interval (weekly, monthly, quarterly) and target value is calculated based on the schedule frequency that you specify in the Expected Progress section of a measure
-
Click +Add to add historical data or a manual target. Historical data refers to past data that has been collected over a specific period of time. Manual target is suggested when you have a specific target value for a certain date - especially if your targets do not follow a consistent trend.

-
Click the three dots against a row to edit values. Click Save to see the progress graph changing accordingly.
- The Running Total and Net Change columns allows you to view the cumulative and non cumulative values in the table.
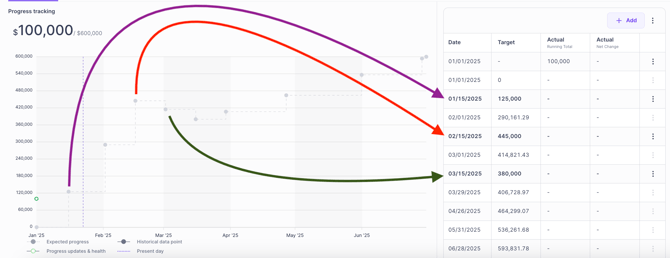
If we have a measure "Achieve $600,000 from targeted outreach" with a 6 month timeline and we set expected progress to monthly - Cascade typically calculates expected progress on a linear trajectory and assumes a steady increase of $100,000 per month.
However, in some cases, you may have specific targets for each month that deviate from this linear pattern. For example, you may want to allocate more resources in certain months or adjust your goals based on external factors. In such cases, setting manual targets allows you to control the progress calculations more accurately.
Below we can see in bold the custom targets on 1/15, 2/15 and 3/15, in which Cascade automatically adjusts the expected progress for the remaining months to ensure the total goal of $600,000 is still met. The resulting graph will display a non-linear trend, with the progress dots reflecting these manual adjustments.
Tip: you can view custom targets in the tracking section when editing a measure
Interpreting the progress graph in the Goal hub

-
Black opaque dots - Displayed in the case for all the data points (current or historical) for manually updated and integrated values.
-
Colored transparent dots - Displayed for values made on the current date. The color is determined by the health at the time of update.
Activity
Displays the entire history of updates (comments, progress updates, risks) made on the entity since the day of its creation, thus leaving a trail for audit.
Updates
Displays what updates were made, by whom, and when. It'll display a snapshot of the update of when the post was made to look into the details from the goals' Sidebar. You can post updates or add comments to these updates here. Also, if you wish to share it elsewhere, you can click the three dots against the update, click Copy Update Link, and paste it in Slack, Teams, mail, etc., to share the link to the Updates page.
Risks
Displays the risks, and its related components. You can also create a new risk from here, or can choose to close or re-evaluate existing risks.