The Metric Library will house all of your existing Metrics - whether it is created manually or connected through an integration, you can customize the way the data comes together through the Metric Sidebar. The Metric Sidebar allows you to edit, delete, or connect a metric to a measure, with three key tabs—Details, Measures, and Table View—providing different insights.
Note that Delete will permanently delete the metric from the library.
Editing the Metric
To edit the Metric, click on the 3 dots in the top right.

- Name of the metric: you can edit the name you have given your metric. If it is connected to a source, we recommend keeping the same name in both applications. Changing the name in Cascade will not change it in your external application,
- Unit: select the unit for your metric or create a new one.
- Input is: determines the format in which the data will be added.
- Cumulative: each new value is added on the previous one.
Note: If the data is cumulative, it will always display the 'Last Value' in the Total is section. Furthermore, if this metric is connected to a measure, it will show the most recent value only. If you wish to use to have the values added/averaged out once in Cascade, do not select this input. - Non cumulative: each new value is independent from the others. You have the option of customizing how the value is displayed with this input.
- Cumulative: each new value is added on the previous one.
- Group data: determines how often the datapoints will be added.
Note: if the metric is connected to a measure, you may want to consider applying changes to the time period on 'expected progress' of the measure so it matches the 'Group data' time period for when there will be datapoints added from the metric.
- Daily: One data point per day.
- Weekly: One data point per week.
- Monthly: One data point per month.
- Quarterly: One data point per quarter.
- Half yearly: One data point per half year.
- Yearly: One data point per year.
- Total is: determines how the value is displayed.
- Sum of values: adds up all values for the chosen time frame.
Input must be non-cumulative - Average of values: calculates the average for the selected period (e.g., quarterly averages).
Input must be non-cumulative - Last value: displays the most recent available value, excluding future entries.
Input can be cumulative or non-cumulative - All time: refers to the full history of recorded data, from the first entry to the present.
Input must be non-cumulative and Total is must be 'sum of values' or 'average of values'
YTD as of: Refers to the period starting from the month selected in the dropdown plus an additional 11 months to provide a yearly time frame. As long as the data remains, changing the period will not delete any historical values should you choose to change the YTD.
Input must be non-cumulative and Total is must be 'sum of values' or 'average of values'.
- Sum of values: adds up all values for the chosen time frame.
- Trend: determines the direction of the metric. It can be "Higher is better" , "Lower is better" or "No Trend". Note, when the metric value matches this criteria, the color will be green. If the metric value is opposite to the trend that's set, then the color will be red.
Tip: If you have a metric that has values spanning multiple years, and you want it to only consider values from a specific year onwards, use "YTD as of" to determine when the values should be considered. Example, NAMER-Operating Profit has monthly values from 2024 and 2025, if you change the YTD as of to 'January', it will only display values from January 2025- December 2025.
Details Tab
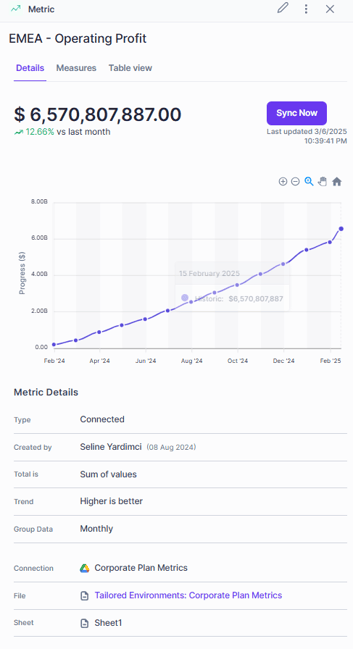
At first glance, this tab shows a line graph that displays the metric's historical data points, followed by a breakdown of all the details that make up the metric depending on the setup that you have determined. Diving into those details we can find
- Type: it can be "Connected" or "Manual".
- Created by: the user that created the metric. Metrics do not have an owner.
- Total is: it can be "Sum of values", "Average of values" or "Last Value".
- Trend: it can be "Higher is better" , "Lower is better" or "No Trend".
- Group Data: it can be "Daily", "Weekly", "Monthly", "Quarterly" , "Half yearly" or "Yearly".
Measures Tab

In this section, you can connect the metric to a measure that already exists in your workspace in order to track it. If a measure is already connected, you will see which a preview of the measure that is currently connected. Note, you can have multiple metrics connected to a measure.
Table View Tab:

The table displays the data points according to the way you have setup your metric. In this example, the time frame is "Monthly" so the table displays one value per month. Only for manual metrics, you can view 'Source data' tab to toggle between Raw and Processed data (For more details, visit Create & Manage Manual Metrics)